Insights and materials
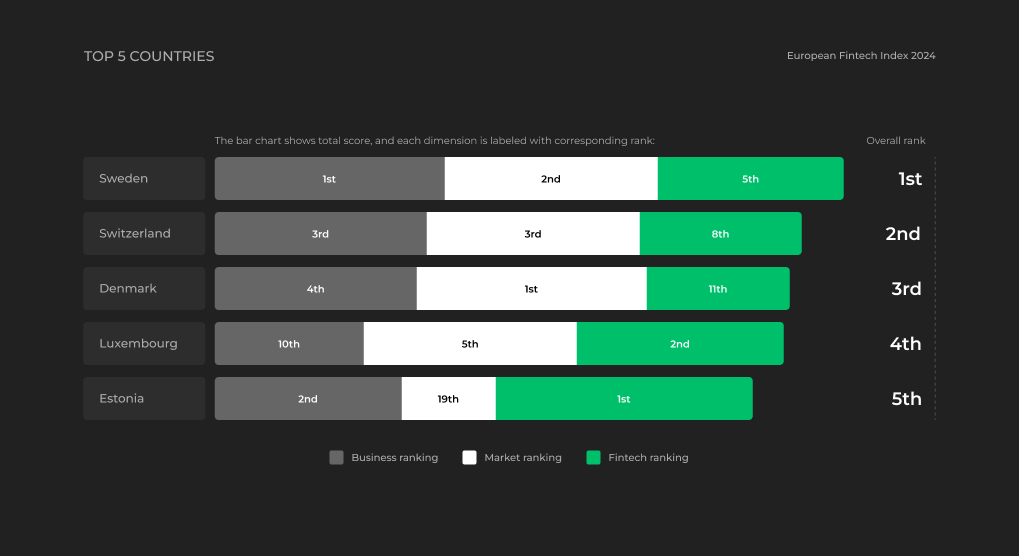
Overview of the TOP Five Ranking Countries
Sweden - a TOP performer across all the ranks
In contrast to countries showcasing varied performance, Sweden consistently ranks within the TOP five positions across all three sectors, achieving its highest rating in the business sector. One of the aspects adding to Sweden’s performance is the high number of ICT and fintech professionals, highlighting its fintech-friendly labor market structure.
Estonia tops the Fintech attractiveness ranking
Estonia excels in the business and fintech sectors, ranking 2nd and 1st, respectively, thanks to its strong unicorn presence per million capita, numerous fintech deals per million capita, and favorable regulatory frameworks. However, Estonia takes 19th place in the Market attractiveness dimension due to lower scores in Gross Value Added and GDP per capita, placing the country 5th in the overall ranking.
Denmark ranks 1st in Market attractiveness
While Denmark takes the 3rd place in the overall ranking, it comes first in the Market attractiveness dimension. Denmark leads the Market attractiveness rankings, supported by strong GDP per capita and private consumption growth indicators.
Leveraging the strengths
The success of countries like Estonia and Luxembourg shows that excelling in specific sectors can significantly contribute to their overall high rankings despite having weaker performance in other areas.
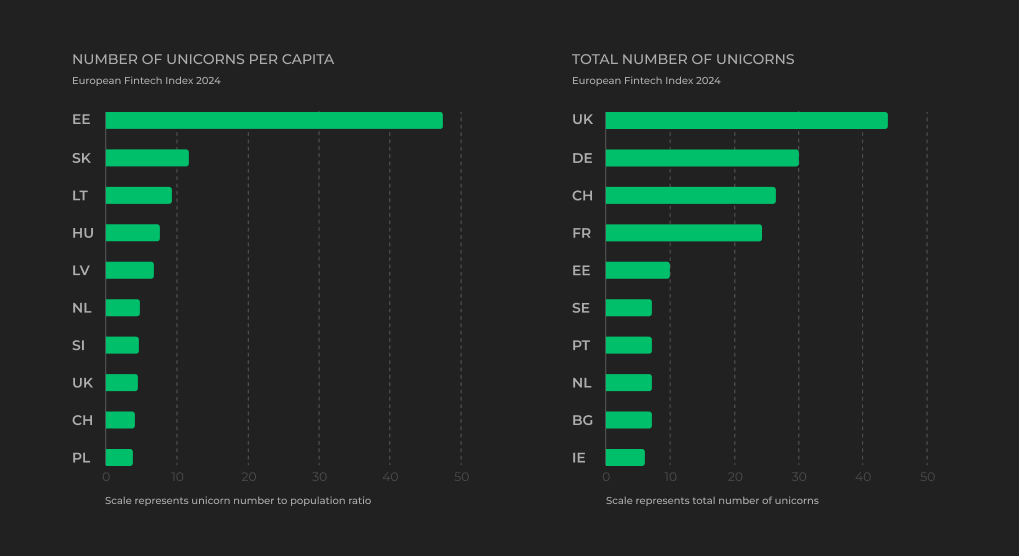
Number of unicorns
High-potential startup cultures
The Unicorns per capita list is topped by Estonia, which leads the list by a significant margin. Following Estonia are Slovakia (SK), Lithuania (LT), Hungary (HU), and Latvia (LV). These countries, though also small in population, show a vibrant startup culture and potential for high innovation.
TOP Unicorn hubs The total number of unicorns list is led by the biggest European economies: the United Kingdom (UK), Germany (DE), Switzerland (CH), and France (FR). Comparing the two TOP 10 lists, the United Kingdom (UK), Estonia (EE), and Switzerland (CH) make the TOP 10 on both lists.
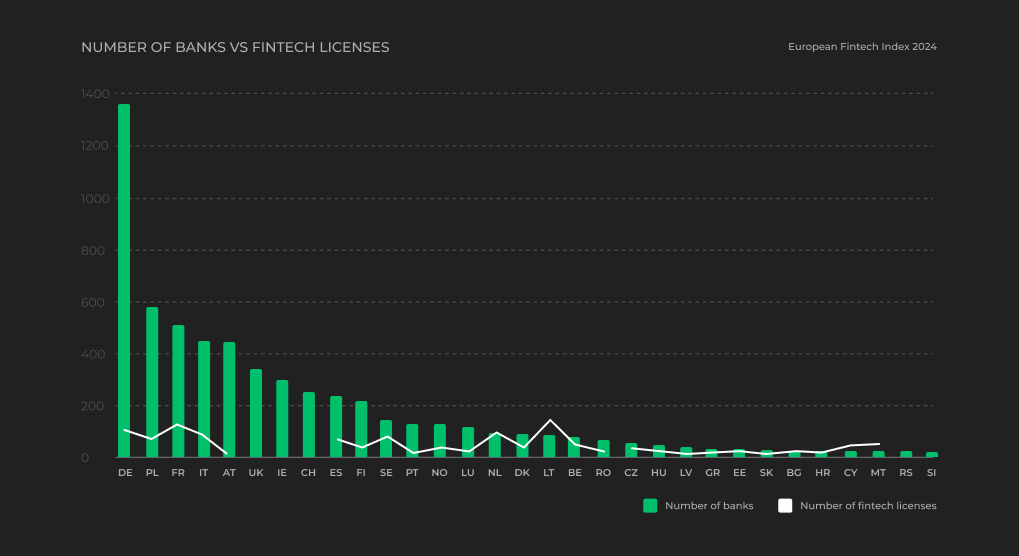
Number of Banks vs Fintech Licences
Stand-out cases
Germany (DE) has the highest number of banks, significantly outpacing all other countries, but only shows relatively average fintech numbers. Towards the right of the chart, countries like Spain (ES), Sweden (SE), Denmark (DK), Lithuania (LT), and Belgium (BE) display a noticeable presence of fintech licenses, particularly Lithuania, which has a high number of fintech licenses compared to its relatively small number of banks.
Breakdown by economy size
Traditional banking is more prevalent in larger, more established economies like Germany, Poland, France, and Italy. On the other hand, smaller countries or those with a focused approach to financial technology, like Lithuania (LT) and Estonia (EE), exhibit a higher number of fintech licenses relative to their banking sector size.
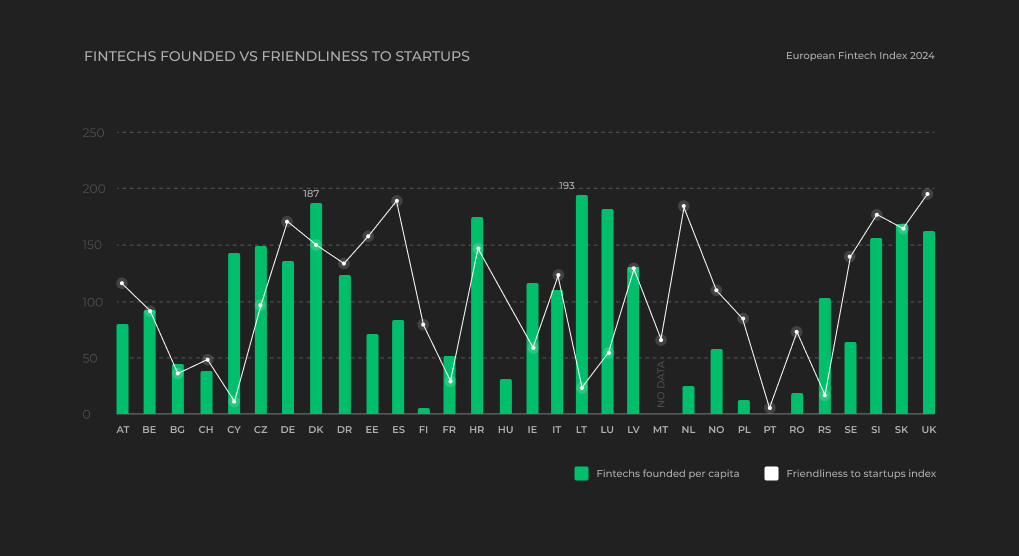
Fintechs Founded vs. Friendliness to Startups
Primary factors for fintech establishment
Friendliness to startups may not be the primary factor when choosing a country to establish a new fintech business. A favorable regulatory framework or other relevant country conditions can often be more critical in this decision. For example, Lithuania and Luxembourg, while not leading in terms of startup friendliness, still attract many fintechs.
Highly-contrasting countries
Such countries as Spain (ES) and the Netherlands (NL) demonstrate a clear contrast between fintechs founded per capita and their friendliness to startups. Despite their highly supportive attitude toward startups, their number is relatively low, which suggests an opportunity to foster entrepreneurial activity more actively.
Balance in startup attraction
However, certain countries manage to excel in both being attractive to startups and hosting a high number of fintechs. The United Kingdom (UK), Denmark (DK), Slovakia (SK), and Slovenia (SI) are prime examples, balancing general startup friendliness with a significant number of fintechs operating within their borders.
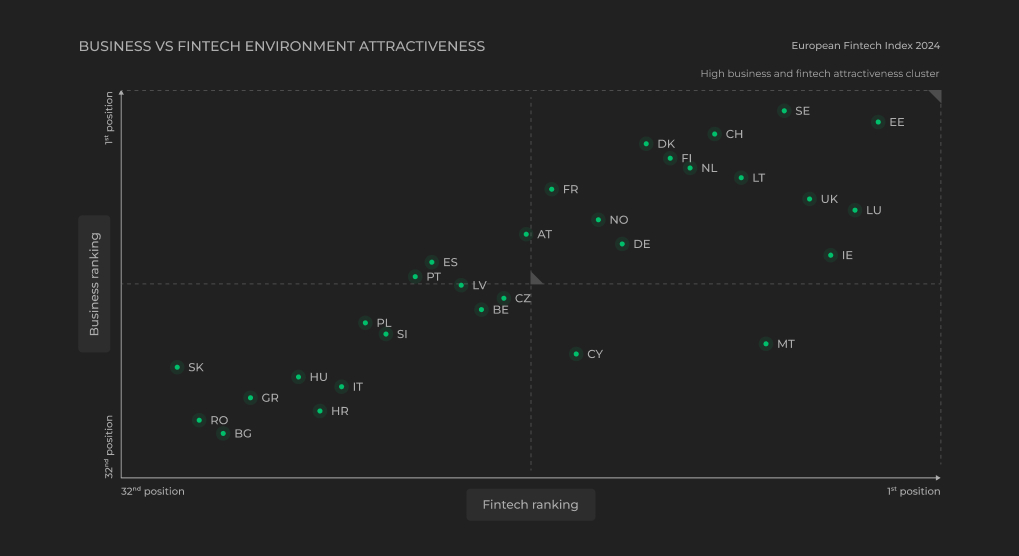
Assessing the Business vs. Fintech Environment Attractiveness
Identifying high-ranking countries We plot the Business and Fintech rankings on one graph. The overall pattern suggests that the two rankings are closely related. It is evident that countries such as Estonia (EE), Sweden (SE), the United Kingdom (UK), and Luxembourg (LU) excel in both business and fintech dimensions. Conversely, Serbia (RS), Romania (RO), Bulgaria (BG), and Slovakia (SK) exhibit less favorable outcomes in both the business and fintech dimensions.
Deviations in pattern However, there are outliers to this positive association - Cyprus (CY) and Malta (MT), for example, perform well in the fintech dimension despite having average business rankings. Similarly, Portugal (PT) and Spain (ES) show higher-than-average business rankings, yet their fintech rankings are below the median.
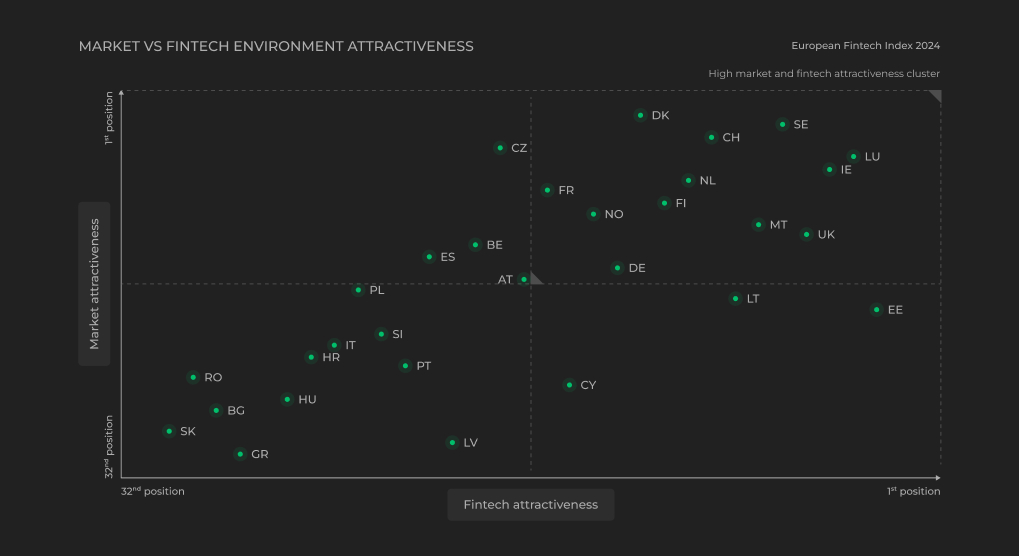
Assessing the Market vs. Fintech Environment Attractiveness
Market vs Fintech rankings We plot the Market and Fintech rankings on one graph. There’s an evident positive association between rankings in these two dimensions. Countries such as Luxembourg (LU), Sweden (SE), and Ireland (IE) show strong performance in both market and fintech sectors. In contrast, Slovakia (SK), Greece (GR), Bulgaria (BG), and Romania (RO) display less favorable outcomes in these areas.
Deviations in pattern Smaller countries like Cyprus (CY), Lithuania (LT), and Estonia (EE) perform well in the fintech sector but showcase below-average market rankings. These countries likely create good conditions for fintech operations, yet the markets are relatively small and, therefore, lack attractiveness in comparison to other larger European countries. In a reversed fashion, Spain (ES), Belgium (BE), and the Czech Republic (CZ) have higher-than-average Market attractiveness rankings, but their fintech performance does not match this level.
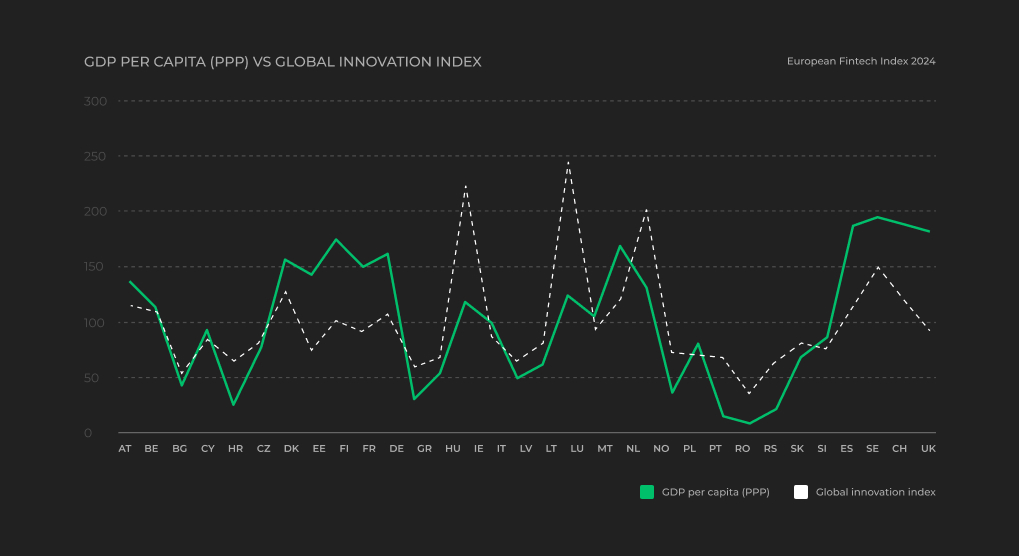
GDP per capita VS Innovation
GDP per capita vs. Innovation The examination of the graph comparing GDP per capita (PPP) and the Global Innovation Index illustrates the positive association between innovation and living standards. In general, countries with higher Global Innovation Index tend to have higher GDP per capita levels.
A closer look at indicator disparities However, some countries, such as Estonia (EE), France (FR), Ireland (IE), and Luxembourg (LU), exhibit distinct disparities and deviations between these two indicators, highlighting the presence of unique cases where the standard correlation does not uniformly apply.